| |
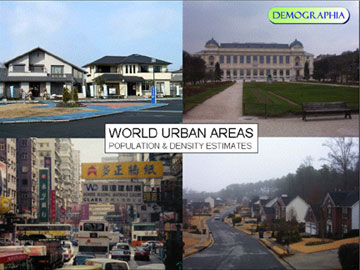
Demographia has issued a new report , World Urban Areas, Population and Density Estimates, (Adobe Acrobat format) ranking the world's 1,117 cities with 500,000 or more people on the basis of population  density. Demographia is one of the websites of Wendell Cox, whose work is often published by the Heartland Institute, a right-wing think tank that wraps itself in a mantle of libertarianism to advance the interests of large corporations. Similarly, Demographia is pro roads, anti mass transit, anti smart growth, and pro sprawl, which is apparently what its new survey is intended to support - its two primary graphs illustrate a positive relationship between low density and high incomes. density. Demographia is one of the websites of Wendell Cox, whose work is often published by the Heartland Institute, a right-wing think tank that wraps itself in a mantle of libertarianism to advance the interests of large corporations. Similarly, Demographia is pro roads, anti mass transit, anti smart growth, and pro sprawl, which is apparently what its new survey is intended to support - its two primary graphs illustrate a positive relationship between low density and high incomes.
The premise is highly contestable - does the relationship represent a cause or a result? The survey measures only widely geographically dispersed urban areas, with highly homogenized results that distort actual conditions. If you look within Chicago, for example, you find relatively low density and poverty in certain neighborhoods, and extraordinarily wealth coupled with extraordinary density along the lakefront. Perhaps even more importantly, many of the cities with the most negative relationship - high density, low income - are in countries like Vietnam and Indian that are only recently forging ahead in industrial development .Interestingly, most of the cities of Europe, fairly high on the wealth scale, fall in the middle in terms of density. Looking at many of the countries whose cities have the highest congruence of low density and high incomes - the U.S., Canada, Australia and Norway - you could easily come to the conclusion that the real relationship of wealth is not to density, but to an abundance of open land. 80% of the least dense cities are in the U.S, but not one of the top 650 most dense. The U.S. accounts for 11 of the top cities in land area, and over half of the top 100. The only other countries to appear in the top 250 least dense are large land mass Australia and Canada, as well as - and your guess is good as mine as to why - France.
But enough discussion. Facts are facts, and the Demographia survey is a fascinating document even if you don't buy into their interpretation of the data. Where does Chicago fit in?
Chicago, at 3,900 people per square mile, is the third most dense city in U.S., after Los Angeles (7,100 people per square mile), and San Francisco (6,100). Chicago less dense than L.A.? A lot of this may come from how the city area is defined - somehow Chicago's urban area has more land area, 2,123 square miles, than L.A.'s 1,688 square miles. (The city of Chicago proper measures only about 228 square miles.) The U.S. census urban area used in the Demographia survey is actually far smaller than the 3,406 square miles of the six county area - it apparently carves out urbanized areas in predominantly rural collar counties and disregards the areas around them.
When you look the differences within the six county area, the report's basic thesis becomes even less tenable:
| County |
Area
|
|
2000 Population |
Density
|
Median Income
|
|
Poverty
|
| Cook |
946
|
|
5.376,741
|
5,684
|
$45,922
|
|
13.5%
|
| DuPage |
334
|
|
909,161
|
2,707
|
$67,887
|
|
3.6%
|
| Lake |
448
|
|
644,346
|
1,438
|
$66,973
|
|
5.7%
|
| Kane |
520
|
|
404,119
|
777
|
$59,351
|
|
6.7%
|
| Kendall |
321
|
|
54,544
|
170
|
$64,625
|
|
3.0%
|
| Will |
837
|
|
502,000
|
600
|
$62,238
|
|
4.9%
|
|
3406
|
|
7,885,921
|
2,315
|
|
|
|
Outside of Cook County, the wealthiest county, DuPage, is also the most densely populated. More to the point: what are the proper conclusions to draw from the data? Are people poor because they live in Chicago? Or do the communities of the less densely settled collar counties read rich because their communities are economically segregated to keep the poor out?
Just asking.
Join a discussion on this story
lynnbecker@lynnbecker.com
© Copyright
2005 Lynn Becker All rights
reserved.
|
|
|
